HPWREN camera web site improvements
July 5, 2022
As of May 2022, HPWREN has released a new version of their camera website with significant user interface and management improvements, including automated layout adjustments based on the viewer's device characteristics, reorganizing site orderings making it easier to locate specific cameras, and refining the integration between each site's images, weather sensors and real time earthquake qaveform data. See https://www.hpwren.ucsd.edu/cameras/ and regional “details” links to observe the bulk of these new capabilities.
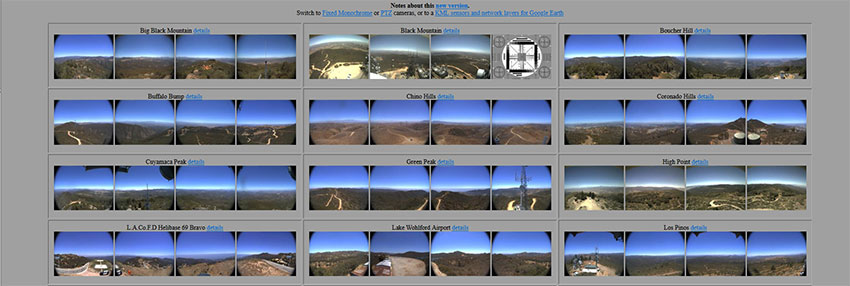
Users will find that the camera banner page is more responsive to screen changes such as resizing or rotation, adding more support for various device types, sizes and display capabilities. The "details" pointers refer to more information about the camera or camera collage at specific sites. The cameras are now sorted alphabetically, and different sort order options can be added.
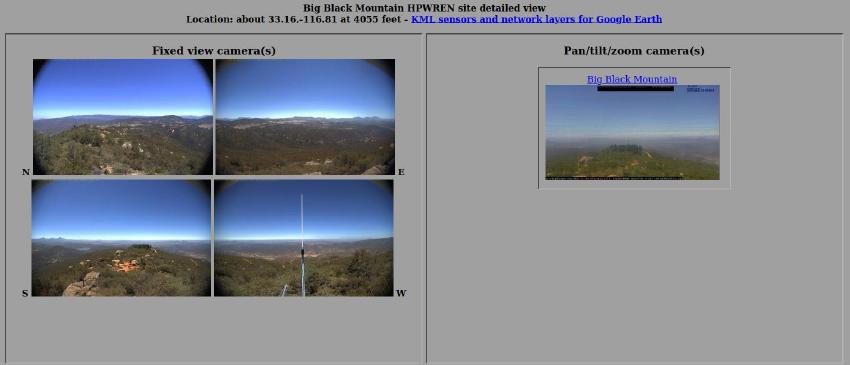
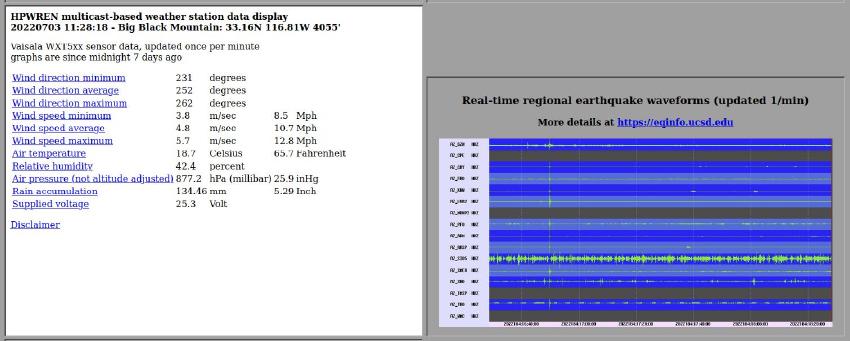
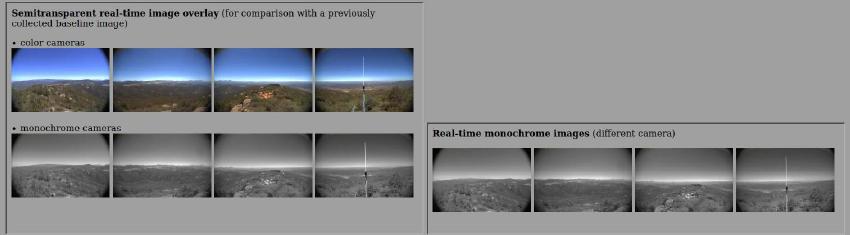
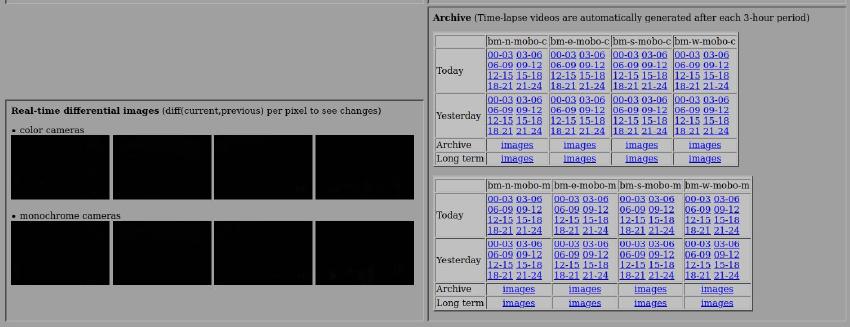
These "site detailed views" collect collages of related imagers, differential image views and image overlay views. They may also include data from other sources, such as a weather station at the local site, or a regional summary waveform image from regional earthquake sensors illustrating some opportunities for presenting and collating date from different kinds of sensors. Also included for fixed (non-moving) cameras is an ability to overlay a semi-transparent layer of the real-time image over a "baseline" image from a good-weather image taken during daytime. This may be useful during obstructed views, e.g., during fires, fog or nighttime. This is not quite complete for all fixed cameras yet, being a work in progress. Also found here are links to all available historical camera images and time-series videos.
Management overhead when adding new cameras has also be greatly reduced through automation. The old website version became increasingly difficult to manage as more and more cameras were being installed. Specifically, in the old version, changes to its multitude of files had to be done by hand, while the new version uses a few (currently spreadsheet based) configuration files from which thousands of HTML/web pages get generated and installed automatically.
Also of note, are the internally [re]designed structures, now based on lists of iframes, which greatly simplify our ability to not only add new cameras, but also other user interface options, such as offering additional sort orders and other customizations as desired. For specifics, please point your browser at any of these pages of interest and tell them to "view page source" (usually available on a right-click in most popular browsers).
A currently incomplete set of KML files is also being generated from those spreadsheets to show HPWREN sensor and network attributes in Google Earth. This allows real-time data to be displayed in Google Earth. The resulting "protruding" vertical columns (towers), visible when rotating the image, show wind speed (height) and wind direction (the more towards red, the closer to NE wind, to get a quick view of "Santa Ana-ish" conditions). Those towers are clickable for all the met data from that site.
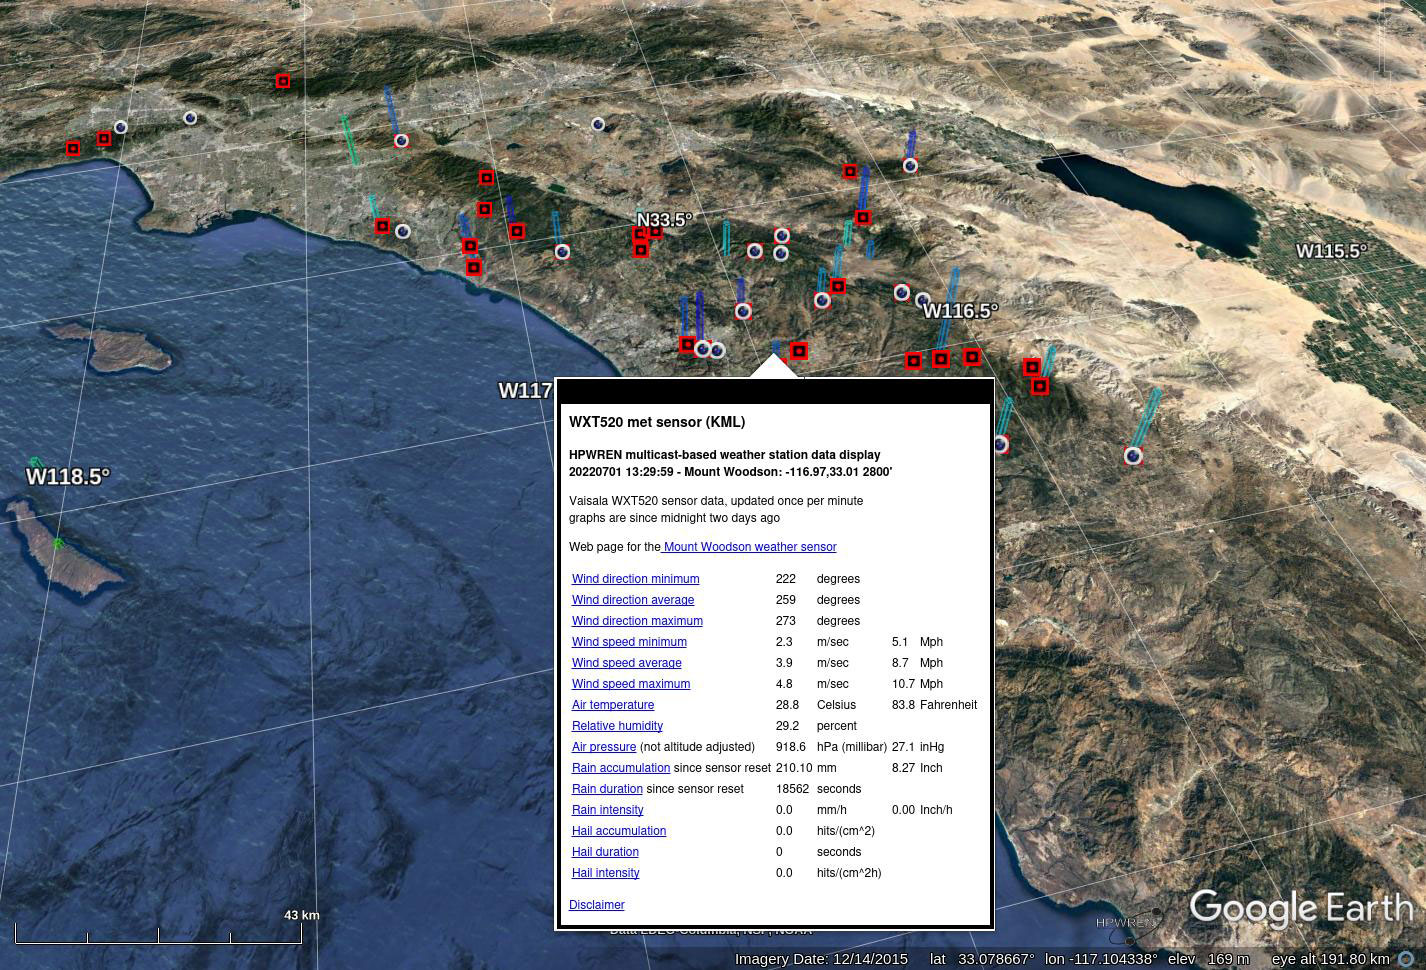
Image of the KML visualization in Google Earth, while showing the real-time meteorological data from one of the weather stations. The camera icons are clickable as well to show real-time images.
You are welcome to submit comments and suggestions for improvements via the referenced (HPWREN feedback mechanism on the main HPWREN web page).