High school student Colin Wessels in Idaho did a summer project with CAIDA and HPWREN on the impact of the pandemic on patterns of air traffic, based on ABS-B data collected via a receiver on Mt. Woodson that is connected to the HPWREN network. This article is his report on the project.
How Coronavirus Affected Air Traffic in Southern California
By Colin Wessels
August 26, 2021
Introduction
This study is based on the speculation that the Coronavirus outbreak significantly affected commercial air travel. By February 2, 2020, just 2 days after the World Health Organization declared a public health emergency, air travel to and from China was restricted. As cases continued to rise, air travel continued to be restricted worldwide. When I was given data on aircraft telemetry in the southern California area, I was curious if these restrictions would be reflected in the data.
An Overview of ADS-B:
ADS-B, short for Automatic Dependent Surveillance-Broadcast, is a technology for air traffic control which uses satellites to determine position rather than traditional radar systems. Starting in 2020, all aircraft flying in controlled airspace are required to have an ADS-B transmitter. This transmitter continuously broadcasts the aircraft’s position, which is determined by GPS, to air traffic controllers and other aircraft. Some websites crowd-source data from ADS-B ground receivers and make the data available for download or provide a live air traffic map. For this project, I used data from an ADS-B receiver on the top of Mount Woodson in southern California starting from October of 2019. This receiver covers roughly 50,000 square miles including Los Angeles, and San Diego.
Results
My main research question I’m trying to answer is this: Did the Covid-19 pandemic impact air traffic? The first idea I had was simply to count how many unique aircraft were detected by the ADS-B receiver each day. When they transmit, the ADS-B transmitters will send the aircraft’s callsign and a hardware identifier unique to the transmitter. Callsigns can change, but this hardware identifier doesn’t, so this is how I counted unique aircraft.
I wanted some way to separate commercial airliners from personal or private aircraft. If Covid-19 did impact air traffic, airliners would feel this impact the most. For this, I needed to look at the altitude distribution. Airliners cruise above 30,000 feet but no higher than 45,000, so Figure 1, planes in green or purple colors are airliners. To ensure that planes aren’t counted multiple times, only the last altitude value for each plane in every time bin is used.
I was also curious about the altitude distribution over the whole day so I could see the mode of the altitude values. Figure 2 uses the mean altitude of each plane over the whole day. While not represented in Figure 2, I can also count the number of planes at San Diego International Airport by checking if a plane’s coordinates are near the airport.
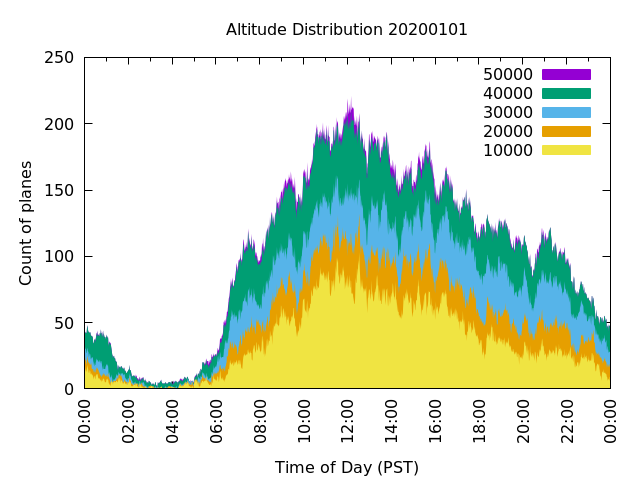
Figure 1: Histogram for 2020-01-01
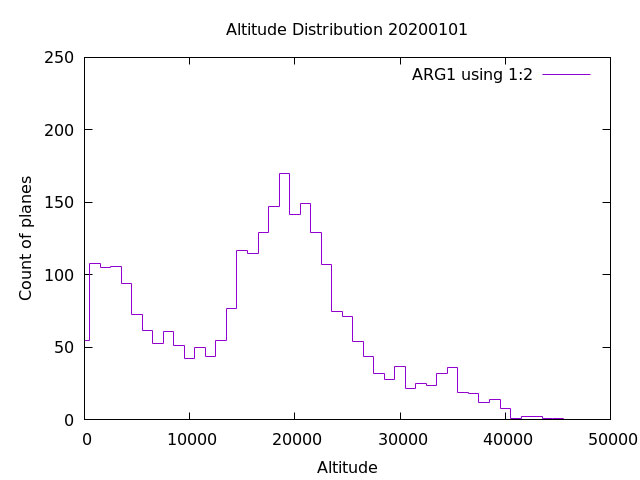
Figure 2: Alternate histogram for 2020-01-01

Figure 3: Histogram for 2019-11-06
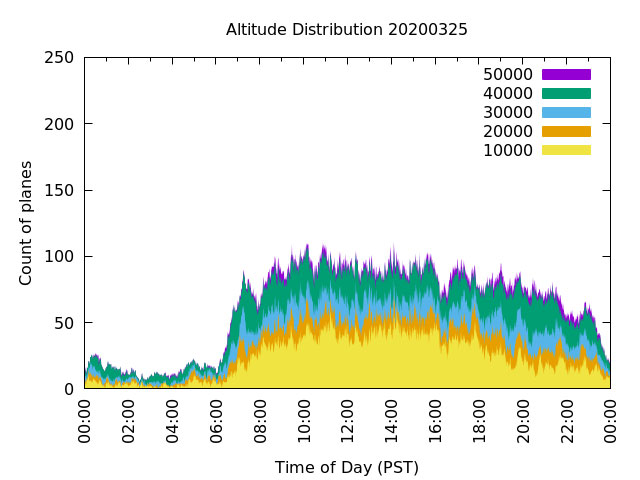
Figure 4: Histogram for 2020-03-25
The graphs above are of two different days. Figure 3 is November 11th of 2019, a day before the public was aware of Covid-19, and Figure 4 is March 25th of 2020, 8 days after the European Union banned nonessential travel and 12 days after the U.S. banned travel from most of Europe. The drop in number of airplanes is clearly visible. For example:
- At 6 AM, there were 14 unique planes at the lowest altitude range in 2019 and 4 planes in 2020.
- At 10 AM, there were 43 planes at the 30000 to 39999 feet range in 2019 and 30 planes in 2020.
- At 10 PM, there were 34 planes in the same altitude range in 2019 and 21 planes in 2020.
- Throughout the whole day, the number of planes changed by this much at each altitude range:
- 41% decrease at 0 to 9999 feet
- 60% decrease at 10000 to 19999 feet
- 52% decrease at 20000 to 29999 feet
- 40% decrease at 30000 to 39999 feet
- 7% decrease at 40000 to 49999 feet
- 42% decrease across all altitude ranges
While the change is noticeable all around, it is most so in the lower to middle altitude ranges. Some other notable observations are:
- The quietest time of the day is always around 4 AM with about 8 unique planes.
- In contrast, the graph during covid doesn’t seem to have a busiest time of the day, unlike the 2019 graph.
- Both days seem to “start” at 6 AM and “end” close to midnight.
Conclusion
The border closings clearly affected air traffic in the southern California area because fewer unique planes were detected during Covid-19 when compared to a day before Covid-19. However, this decrease is most dramatic in the lower altitude ranges. Whether this means less people flew personal aircraft during Covid-19 or that less airliners were landing and taking off, I don’t know, but it’s clear that air traffic as a whole was greatly impacted by Covid-19.
I’ll leave you with one last graph. Figure 5 is a histogram of June 16th, 2021. By now, air travel has returned to normal, pre-covid levels. When compared to Figure 3, there is no clear permanent impact on air traffic.
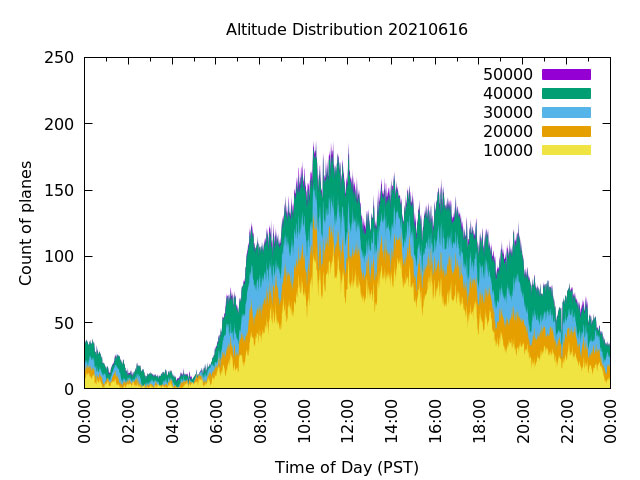
Figure 5: Histogram for 2021-06-16