|
|
|
|
March 24, 2011
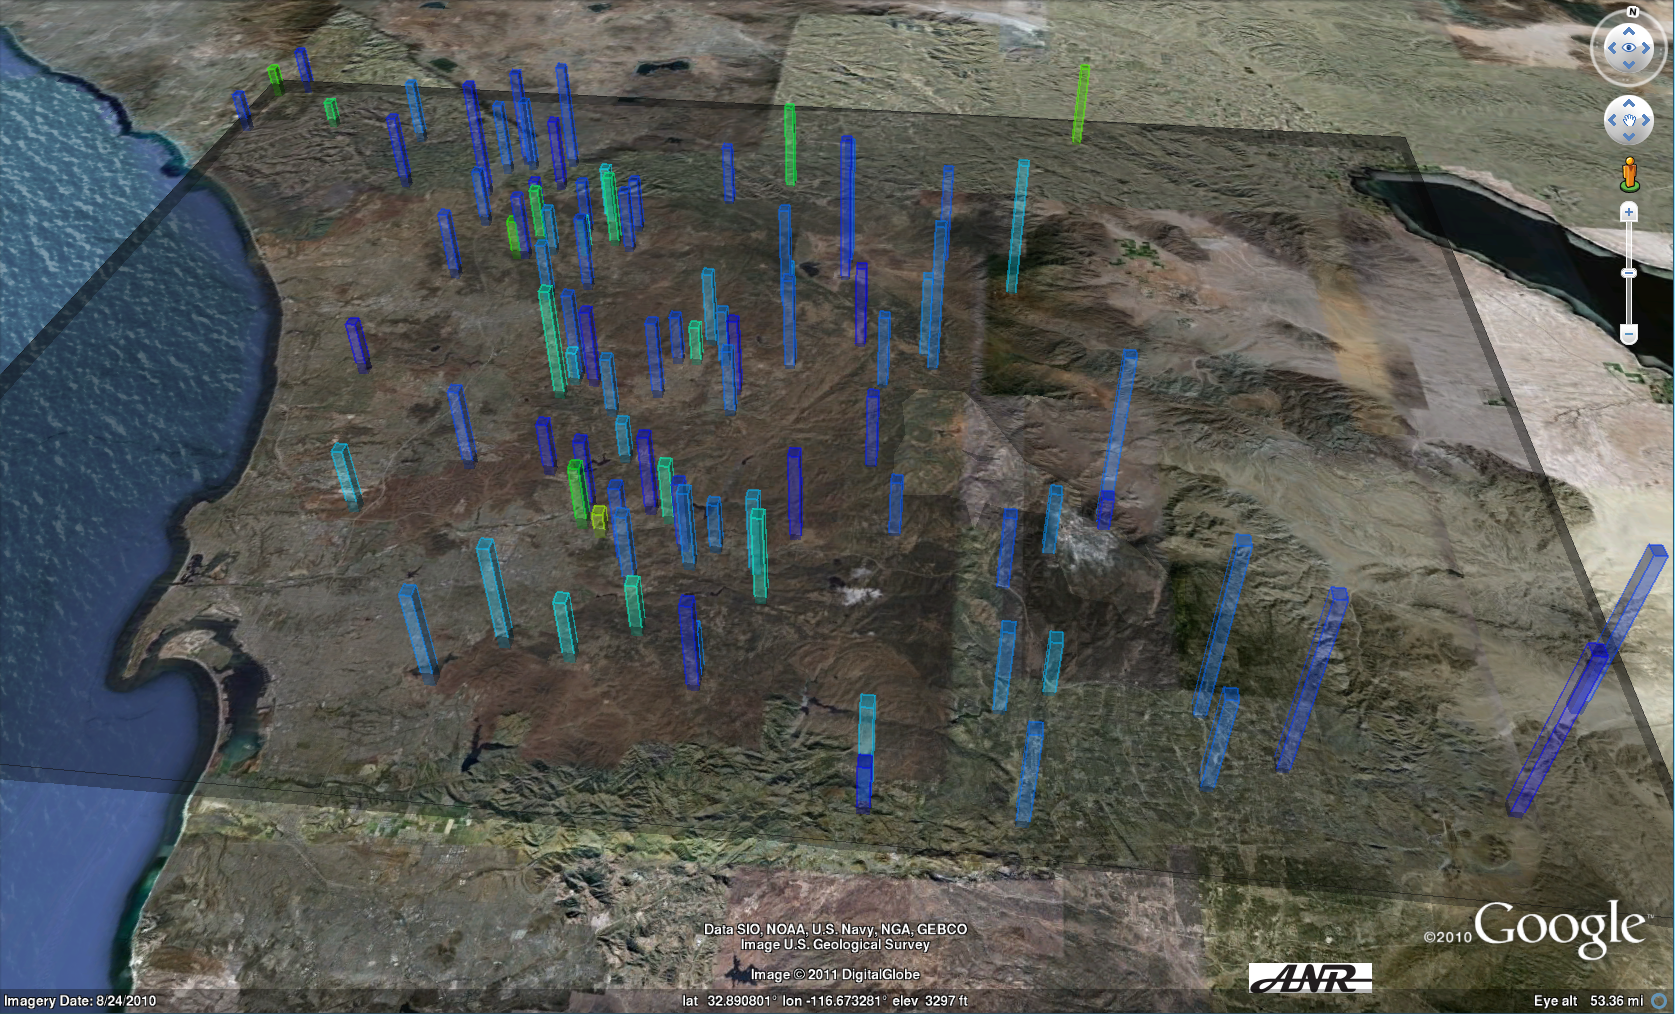
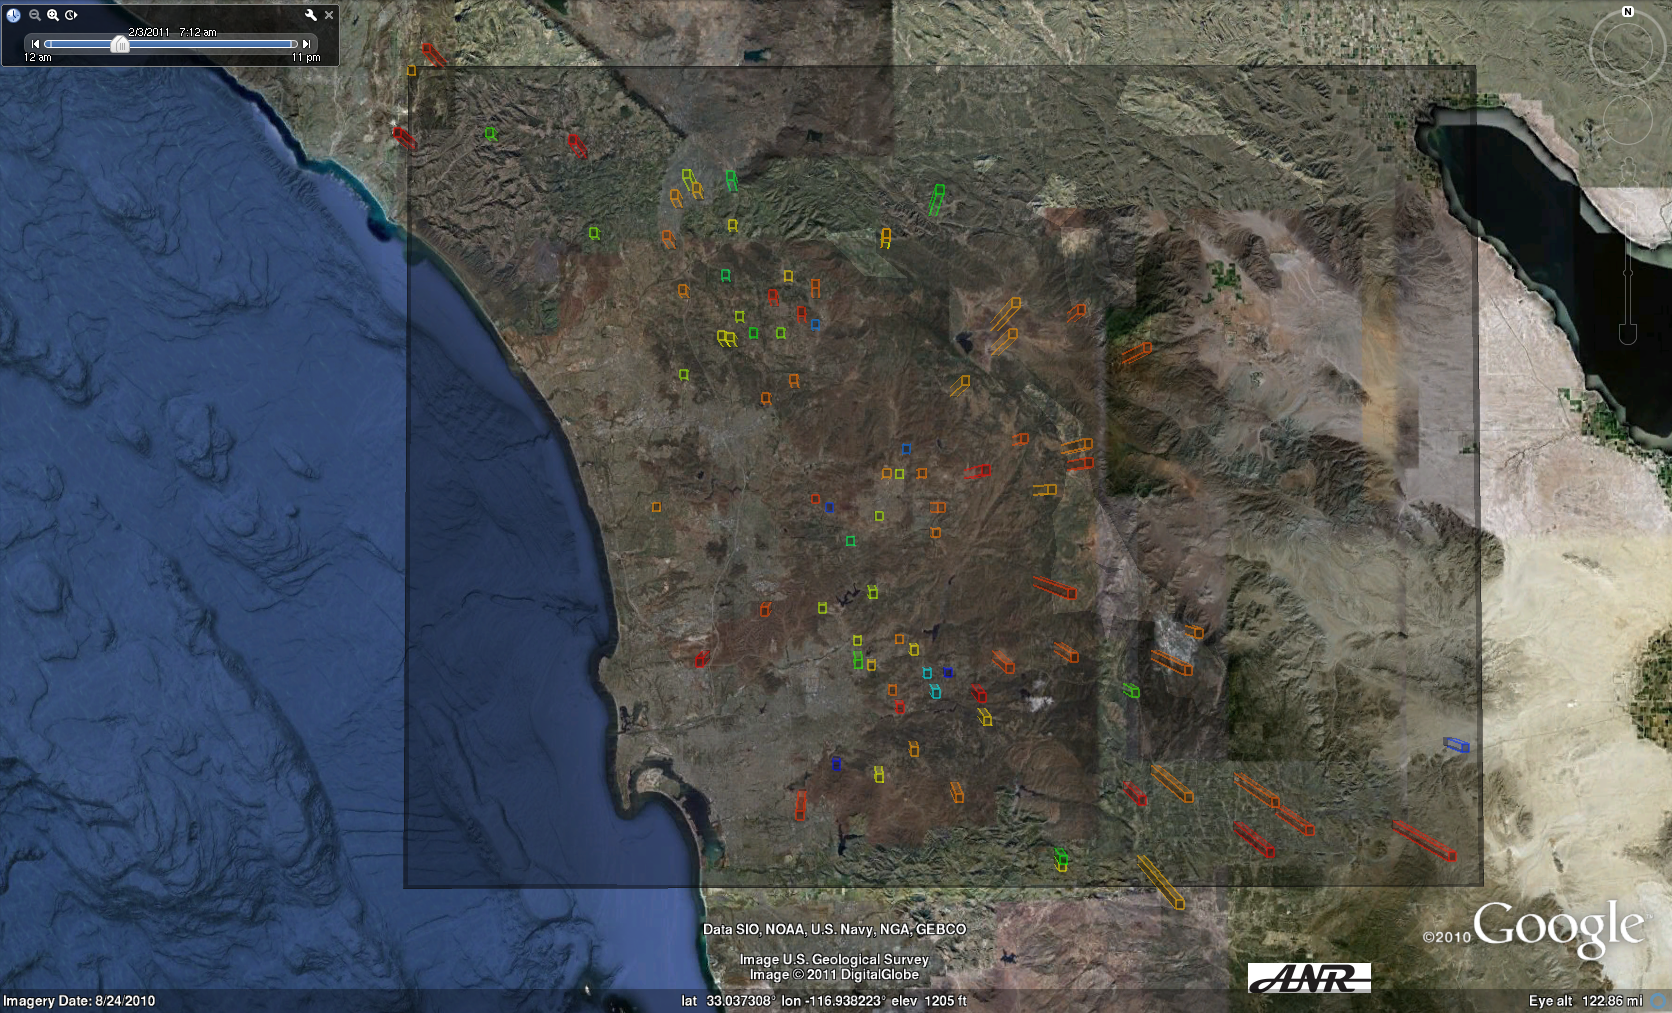
Experimental real-time Google Earth visualizations of SDG&E and HPWREN meteorological sensor data focuses on Santa Ana conditions Visualizing meteorological data is a much more complex problem than it seems at first, specially if many metrics, many sensor stations, and many interpretation objectives are to be considered. To reduce complexity, while focusing on the real Santa Ana threat, the visualizations described here only focus on wind speeds and wind directions typical to such Santa Ana conditions, and a subset of metrics used at /news/041106.html. Some notes:
The following KML objects create multi-megabyte output files, based on archived data to be sent to the (likely) Google Earth application. Note the time series animation option in the upper left of the Google Earth screen; clicking the "wrench" allows for changing thing like animation speed an looping.
Some technical details Key to this sensor system framework is an ability to multicast real-time raw and processed data, which immediately makes such data available to be picked up by multiple computers and processes, without additional load on the originating process or on the network bandwidth. Many sensors on HPWREN support a serial line interface, which is then made available to the network via serial-to-Ethernet converters. Some of the sensors have their own multicast translation processors, for others a centralized server collects data from the field-deployed sensor stations not having their own multicast translators, and multicasts the data to the network. A separate process retrieves new SDG&E meteorological data every ten minutes and multicasts it to the network. Long term archival of the data is accomplished by a separate machine receiving the multicasted telemetry streams, and storing them onto a RAID array via a hierarchical date/sensor file structure. Further processes are picking up various multicast streams, and making them publicly available in real-time via TCP sockets. A centralized machine collects sensor data off the multicast streams, and processes it into various HTML or KML files for the web interface. On the same machine, received meteorological data is forwarded to NOAA/NWS servers, automated Santa Ana alarms are being issued to public safety agencies based on analyzing the multicasted data, and sensor outage alarms are being sent to project staff. Finally, a web front end machine makes data publicly available on the Internet. The KML files described in this article are derived from the data on the telemetry server for the archived data. The real-time KML interface involves multiple processes listening to the multicasted data streams for the HPWREN and the SDG&E sensors, and converting them to various small KML files, which are then (re-)loaded into Google Earth, based on appropriate time intervals (currently ten seconds for HPWREN sensors, and ten minutes for SDG&E sensors), via the main KML object. |