|
|
|
|
April 13, 2010
A New Tool for Creating Ground Shaking Intensity Maps?:
By Dr. Kris Walker, IGPP/SIO/UCSD The Mw 7.2 earthquake in northeast Baja California, Mexico generated respectable seismic waves that were felt for up to a minute and a half throughout Southern California and northern Baja. The locations of the epicenter, aftershocks, and surface rupture (see http://www.scsn.org/2010sierraelmayor.html) suggest that the rupture was not focused at one specific location, but initiated near El Mayor, Mexico and extended northwest for roughly 45 miles through the U.S. border.
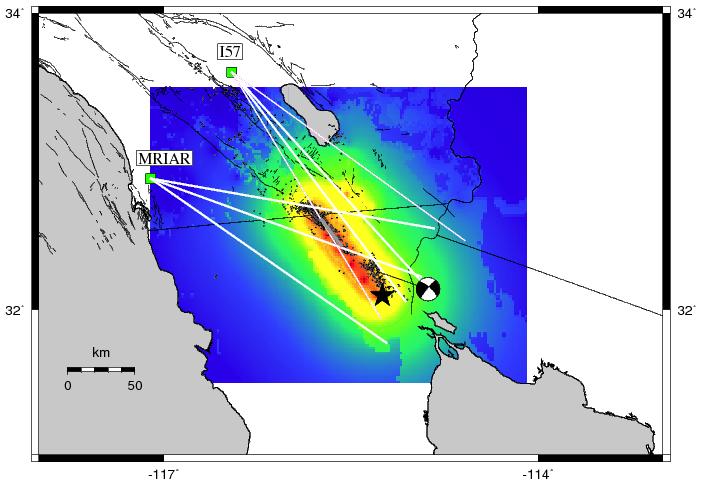
The shaking in the vicinity of the rupture also radiated low frequency sound waves (called "infrasound") that were detected at least 125 miles away by two sensitive infrasound arrays operated by the Laboratory for Atmospheric Acoustics (L2A) at UCSD (Figure 1). The data from these arrays are transmitted to an L2A server in near real-time via the High-Performance Wireless Research and Education Network (HPWREN). Timely retrieval and analysis of this data is important because it facilitates rapid dissemination of information that pertains to events of scientific interest and societal significance (like sonic rumbles or "booms"). Just an hour after this event occurred, we analyzed the MRIAR data and came to most of the conclusions presented here. The I57 data were analyzed later the same day. The L2A group is developing a website that will contain advisories from triggers that run on the infrasound array data in near-real time. Such advisories will likely be useful to the local community; there are typically one or two sonic disturbances (often called "mystery booms") every year that generate widespread interest for days. A computational method called "beamforming" is routinely performed on the infrasound array data to detect infrasound signals and determine the direction at the array from which these signals came (or signal "back azimuth" and "elevation angle"). Two signals were observed at I57US (located in southern California) with a back azimuth of about 140 degrees, which points a bit to the east of the Mw 7.2 rupture zone (Figure 1). These signals have a relatively poor signal-to-noise ratio, and the 95% uncertainty of these signal back azimuths spans the rupture zone.
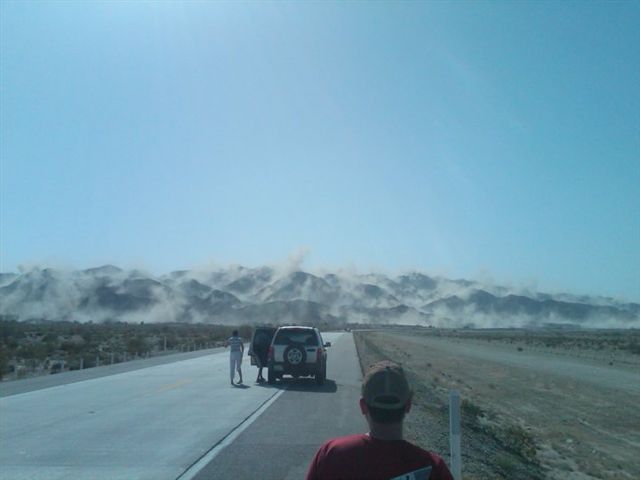
The six-microphone array at MRIAR, also in southern California, observed many more infrasound signals in the 0.5-5.0 Hz band than I57US (Figure 2). These signals are divided into three groups. The first group comprises very loud signals with amplitudes of up to 10 Pa (about 114 dB SPL, five times louder than a hack hammer at three feet distance). These loud "coseismic" signals originated from the conversion of seismic energy directly beneath the array to acoustic energy above the array. The second group of signals arrived shortly after the seismic signals and lasted three minutes. These signals are not from local seismic-to-acoustic coupling. The signal back azimuth range of 172-190 degrees and very low elevation angles suggest a local source to the south of the array. One possibility is that these signals were from an aircraft en route to Miramar Marine Corps Air Station or the San Diego International Airport. MRIAR is located in a noisy environment, although it was relatively quiet on Easter Sunday when the rupture occurred. Another explanation is that these signals originated from nearby seismic shaking of ground or manmade structures like tall buildings, bridges, and overpasses. The third group of signals at MRIAR are the most interesting. These signals arrived several minutes later and lasted six minutes (Figure 2). The signal elevation angles of about 25 degrees are typical for stratosphere-refracted waves. The signals within the first two minutes have easterly back azimuths of about 100 degrees. This is followed by a transition in back azimuths over the span of a minute from about 100 degrees to about 123 degrees. During the final three minutes, the signal back azimuths remain about 123 degrees. Projection of these back azimuths show that these signals appear to come from this approximately 45 mile long rupture. In summary, the infrasound signals observed at MRIAR and I57US in southern California are consistent with the strong ground shaking that is expected in the vicinity of the Mw 7.2 rupture (Figure 1). Specifically, the signal back azimuths at I57US span the rupture within the uncertainties of the data. At MRIAR, the signal back azimuths and elevation angles are better constrained and suggest a spatially extended remote source. The intersections of back azimuth projections from MRIAR and I57US span the Mw 7.2 rupture, the location of which is inferred from seismic and surface rupture mapping data. Figure 3 shows a photo taken right after the earthquake of a mountain range (likely along the Borrego fault) that was "dusted" by shaking associated with the rupture. It is no surprise that ground shaking also creates infrasound. With the recent advances in (1) infrasound wind filters that improve infrasound data quality and (2) near-real time atmospheric velocity models that improve our ability to predict infrasound amplitudes and ray paths, infrasound arrays in seismically active areas, perhaps sharing infrastructure with existing seismic stations, may provide an independent, but relatively direct measure of the relative intensity of surface shaking for large M > 7 earthquakes and assist hazard response efforts.
Other websites of interest: |